US Post Offices ✉️
Plot No. 1
By Sylvi Rzepka (@SylviRz)
library(tidytuesdayR)
library(tidyverse)
library(ggtextures) # for geom_isotype_col()
library(magick) #for image_read
library(grid) # for the  geom_isotype_col
postoffice <- tidytuesdayR::tt_load('2021-04-13')$post_offices
#summary statistics
table(postoffice$state)
summary(postoffice$established)
summary(postoffice$discontinued)
#data preparation
postofffice_prep<-postoffice %>%
  select(id, established, discontinued, continuous) %>%
  filter(established>1600) %>%
  filter((discontinued>1600 & discontinued<2002) | is.na(discontinued)) %>%
  # some post offices close earlier than they open (inconsistency)
  filter(established<=discontinued | is.na(discontinued))
#counting post office openings each 50 years
openings <- postofffice_prep %>%
  mutate(years=case_when(
    established>=1600 & established<1800 ~ "1600-1800",
    established>=1800 & established<1820 ~ "1800-1820",
    established>=1820 & established<1840 ~ "1820-1840",
    established>=1840 & established<1860 ~ "1840-1860",
    established>=1860 & established<1880 ~ "1860-1880",
    established>=1880 & established<1900 ~ "1880-1900",
    established>=1900 & established<1920 ~ "1900-1920",
    established>=1920 & established<1940 ~ "1920-1940",
    established>=1940 & established<1960 ~ "1940-1960",
    established>=1960 & established<1980 ~ "1960-1980",
    established>=1980  ~ "1980-2002")
  ) %>%
  group_by(years) %>%
  summarise(number_openings=n()) %>%
  mutate(ever_open=cumsum(number_openings)) #cumulative number of postoffices that were ever opened
#counting post office openings each 50 years
closures <- postofffice_prep %>%
  mutate(years=case_when(
      discontinued>=1600 & discontinued<1800 ~ "1600-1800",
      discontinued>=1800 & discontinued<1820 ~ "1800-1820",
      discontinued>=1820 & discontinued<1840 ~ "1820-1840",
      discontinued>=1840 & discontinued<1860 ~ "1840-1860",
      discontinued>=1860 & discontinued<1880 ~ "1860-1880",
      discontinued>=1880 & discontinued<1900 ~ "1880-1900",
      discontinued>=1900 & discontinued<1920 ~ "1900-1920",
      discontinued>=1920 & discontinued<1940 ~ "1920-1940",
      discontinued>=1940 & discontinued<1960 ~ "1940-1960",
      discontinued>=1960 & discontinued<1980 ~ "1960-1980",
      discontinued>=1980  ~ "1980-2002")
  ) %>%
  group_by(years) %>%
  summarise(number_closure=n()) %>% # assuming NA indicates count of post offices that never closed
  mutate(ever_close=cumsum(number_closure))

letter_img <- image_read("/Users/rzepka/Documents/Correlaid/TidyTuesday/TidyTuesday/letter2.png")
#    https://thenounproject.com/coquet_adrien/collection/mail/?i=953541")

open_close<-merge(openings, closures, all=TRUE) %>%
  filter(!is.na(years)) %>% # dropping count of post offices that never closed
  mutate(years=as.factor(years)) %>%
  mutate(number_closure=ifelse(is.na(number_closure), 0, number_closure)) %>%
  #subtract closures frin current open number of post offices
  mutate(current_number=round((ever_open-ever_close),0), # each letter will stand for a 100 postoffices
         letter_img="/Users/rzepka/Documents/Correlaid/TidyTuesday/TidyTuesday/letter2.png")
#Plotting
#Load a font from Google Fonts
sysfonts::font_add_google("Homemade Apple", regular.wt = 400)
sysfonts::font_add_google("Raleway", regular.wt = 400)
showtext::showtext_auto()
#quartz() # to make the font work
#Rise and fall of the US Post Offices
open_closeplot<-ggplot(open_close, aes(x=years, y=current_number, image = letter_img)) +
#geom_bar(stat="identity") +
geom_isotype_col(img_width = grid::unit(0.9, "native"), img_height = NULL,
ncol = 1, hjust = 0, vjust = 0.5) +
theme_minimal() +
theme(text = element_text(size = 11, colour = "black", family="Raleway"),
plot.title = element_text(size = 24, face = "bold", family="Homemade Apple"),
plot.title.position="plot", #left align title
plot.subtitle= element_text(margin=margin(b=50)), #trbl #increase space between subtitle and plot
plot.background =element_rect(fill = "cornsilk"),
panel.grid = element_blank(),
axis.title.x = element_text(margin = margin(t = 10)), #increase space between label and axis
axis.title.y = element_text(margin = margin(r = 10)),
axis.text.x = element_text(margin = margin(t = 0)), # move the labels closer to the bars
axis.ticks = element_blank() ) +
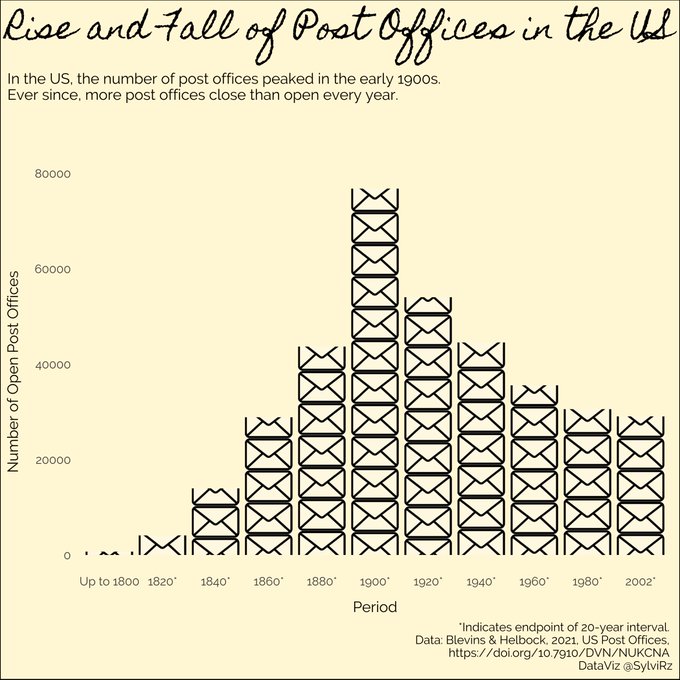
labs(title = "Rise and Fall of Post Offices in the US",
subtitle = "In the US, the number of post offices peaked in the early 1900s. \nEver since, more post offices close than open every year.",
x= "Period",
y= "Number of Open Post Offices",
caption = "Data: Blevins & Helbock, 2021, US Post Offices, \nhttps://doi.org/10.7910/DVN/NUKCNA \nDataViz @SylviRz") +
scale_x_discrete(guide = guide_axis(n.dodge=2)) # so that x-axis labels don't overlap
open_closeplot
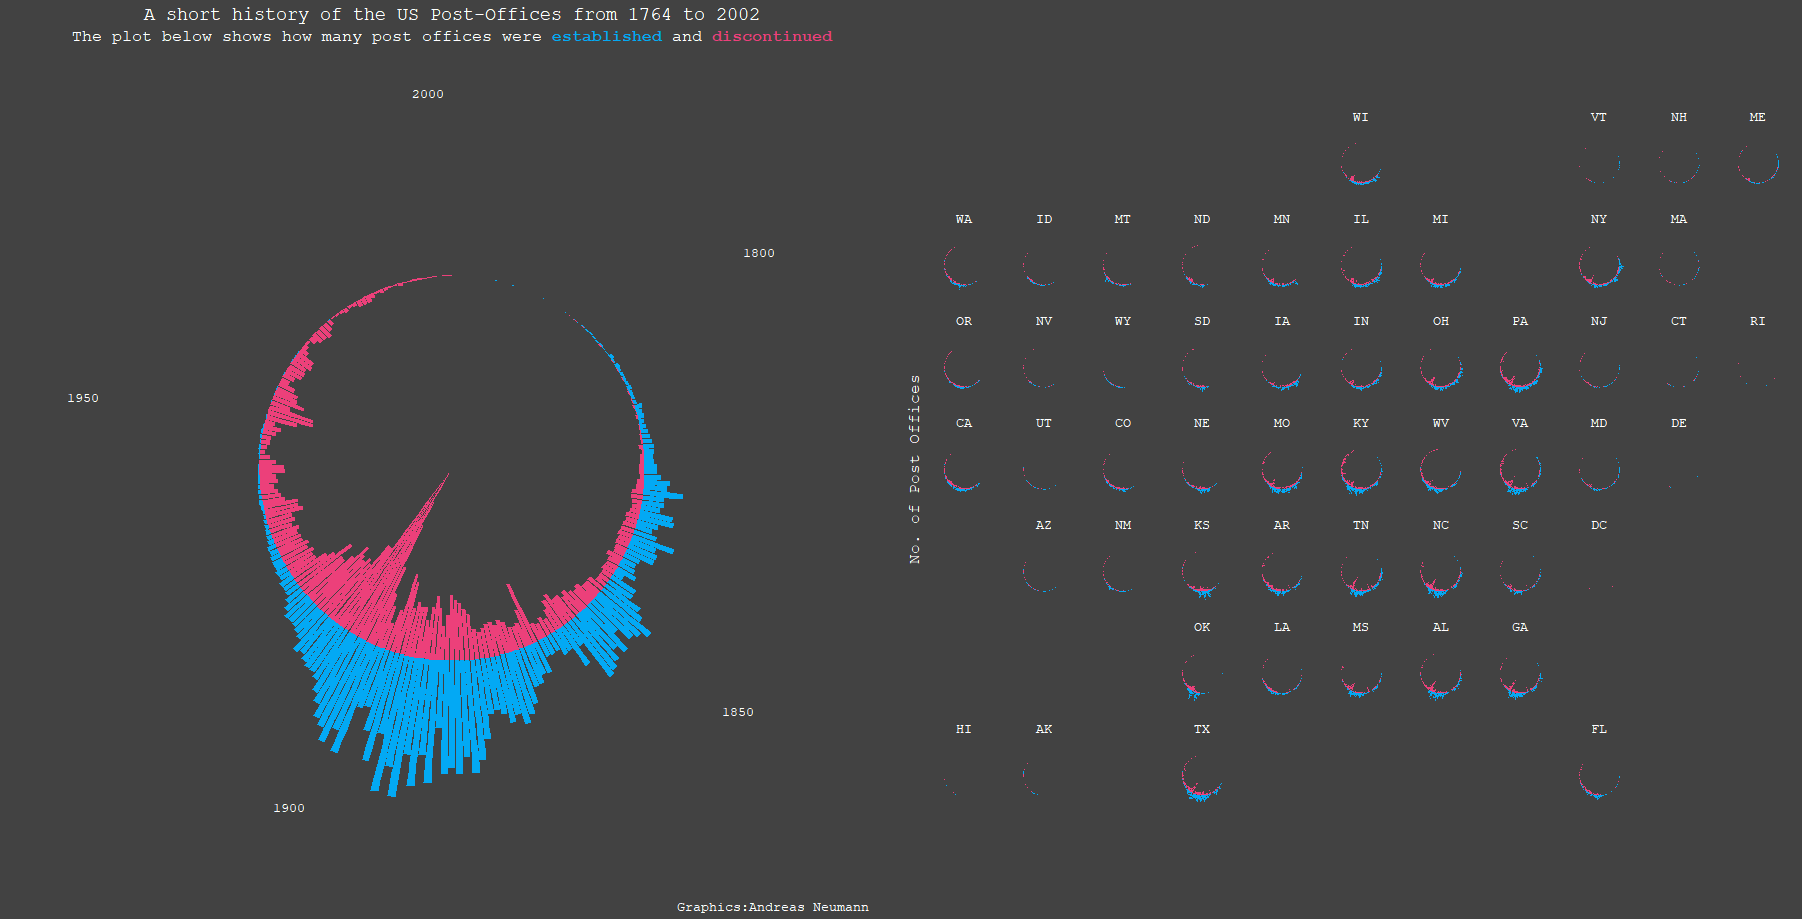
Plot No. 2
By Andreas Neumann